

Rosen Charts: React Chart Library for RSC and Shadcn
Copy-paste React chart components with RSC support, shadcn CLI setup, and full SVG/HTML customization.
Front‑end developers and data engineers building interactive, high‑performance visualisations for web applications
ChartGPU is an open-source TypeScript charting library that uses WebGPU for high-performance rendering of large datasets, achieving 1M+ points at 60fps.
It supports line, area, bar, scatter, pie, and candlestick charts with features like GPU-accelerated LTTB downsampling, streaming updates, zoom, tooltips, and crosshairs. Installation via npm includes React bindings; requires Chrome 113+ or Edge 113+ with WebGPU enabled.
Copy-paste React chart components with RSC support, shadcn CLI setup, and full SVG/HTML customization.
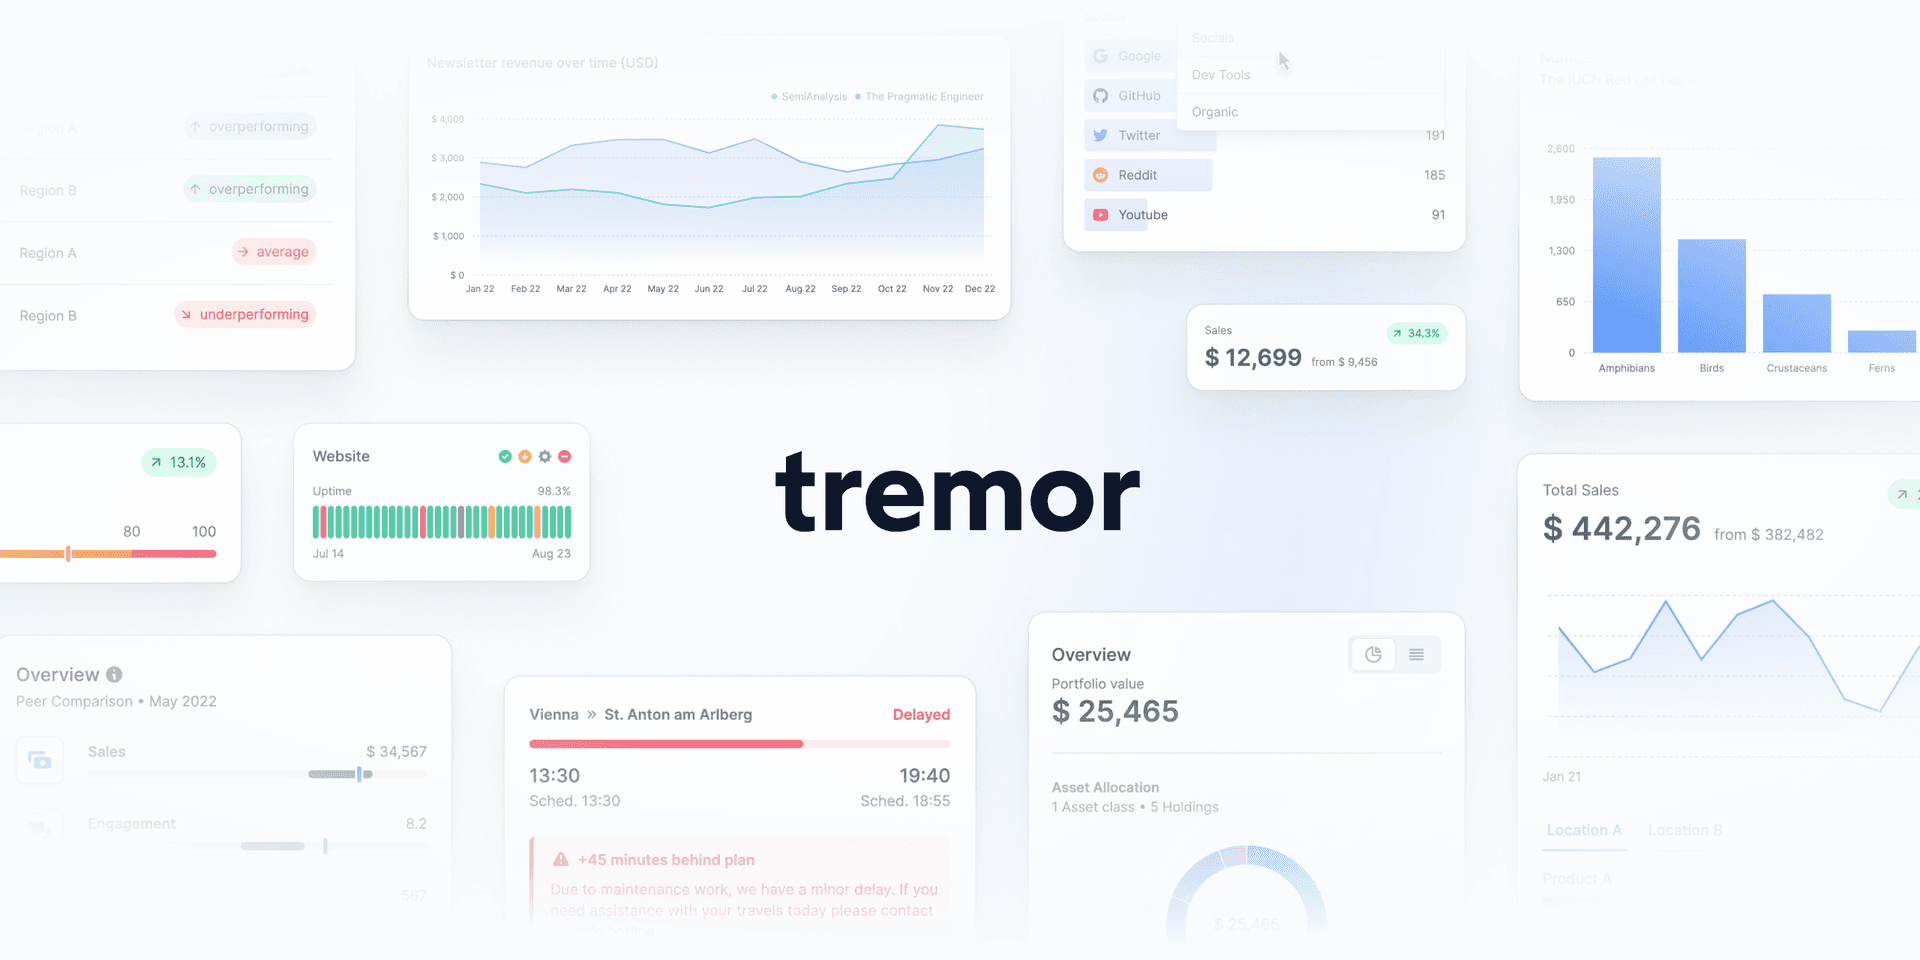
Copy & Paste React components to build modern web applications. - GitHub - tremorlabs/tremor: Copy & Paste React components to build modern web applic...

Gemma Gem runs Google’s Gemma 4 model entirely on-device via WebGPU — no API keys, no cloud, no data leaving your machine. - kessler/gemma-gem