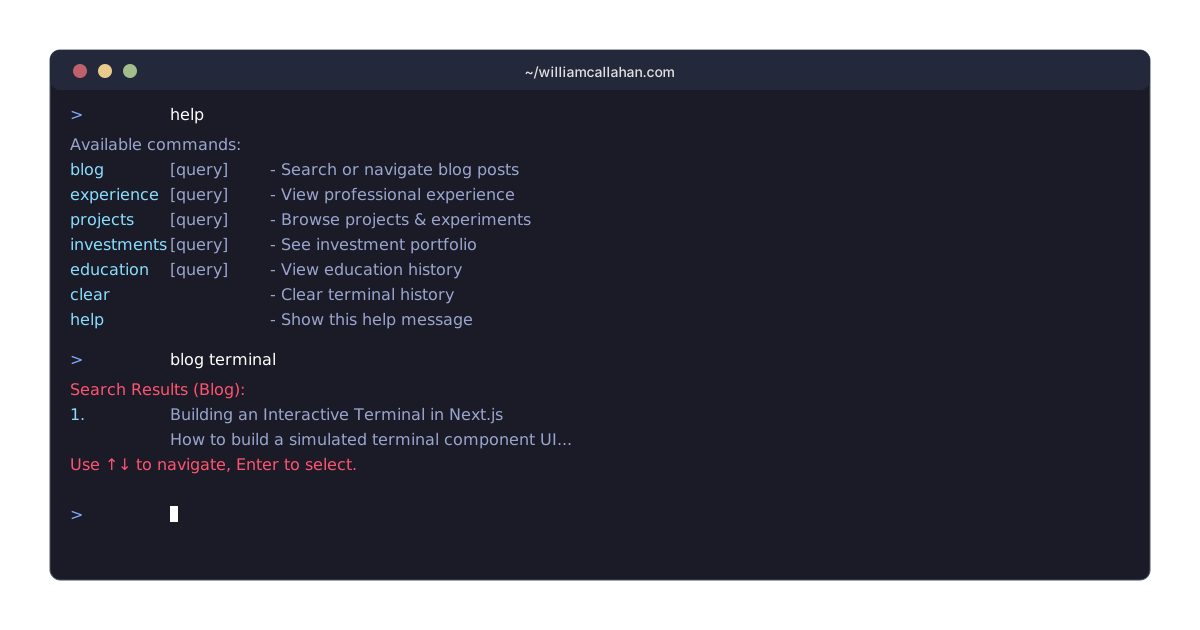
Welcome! Type "help" for available commands.
$
Loading terminal interface...
Back to Blog

Adding a GitHub Contribution Graph to Next.js

April 2, 2025
William Callahan

Software engineer and founder with a background in finance and tech. Currently building aVenture.vc, a platform for researching private companies. Based in San Francisco.
Adding a GitHub Contribution Graph to Next.js

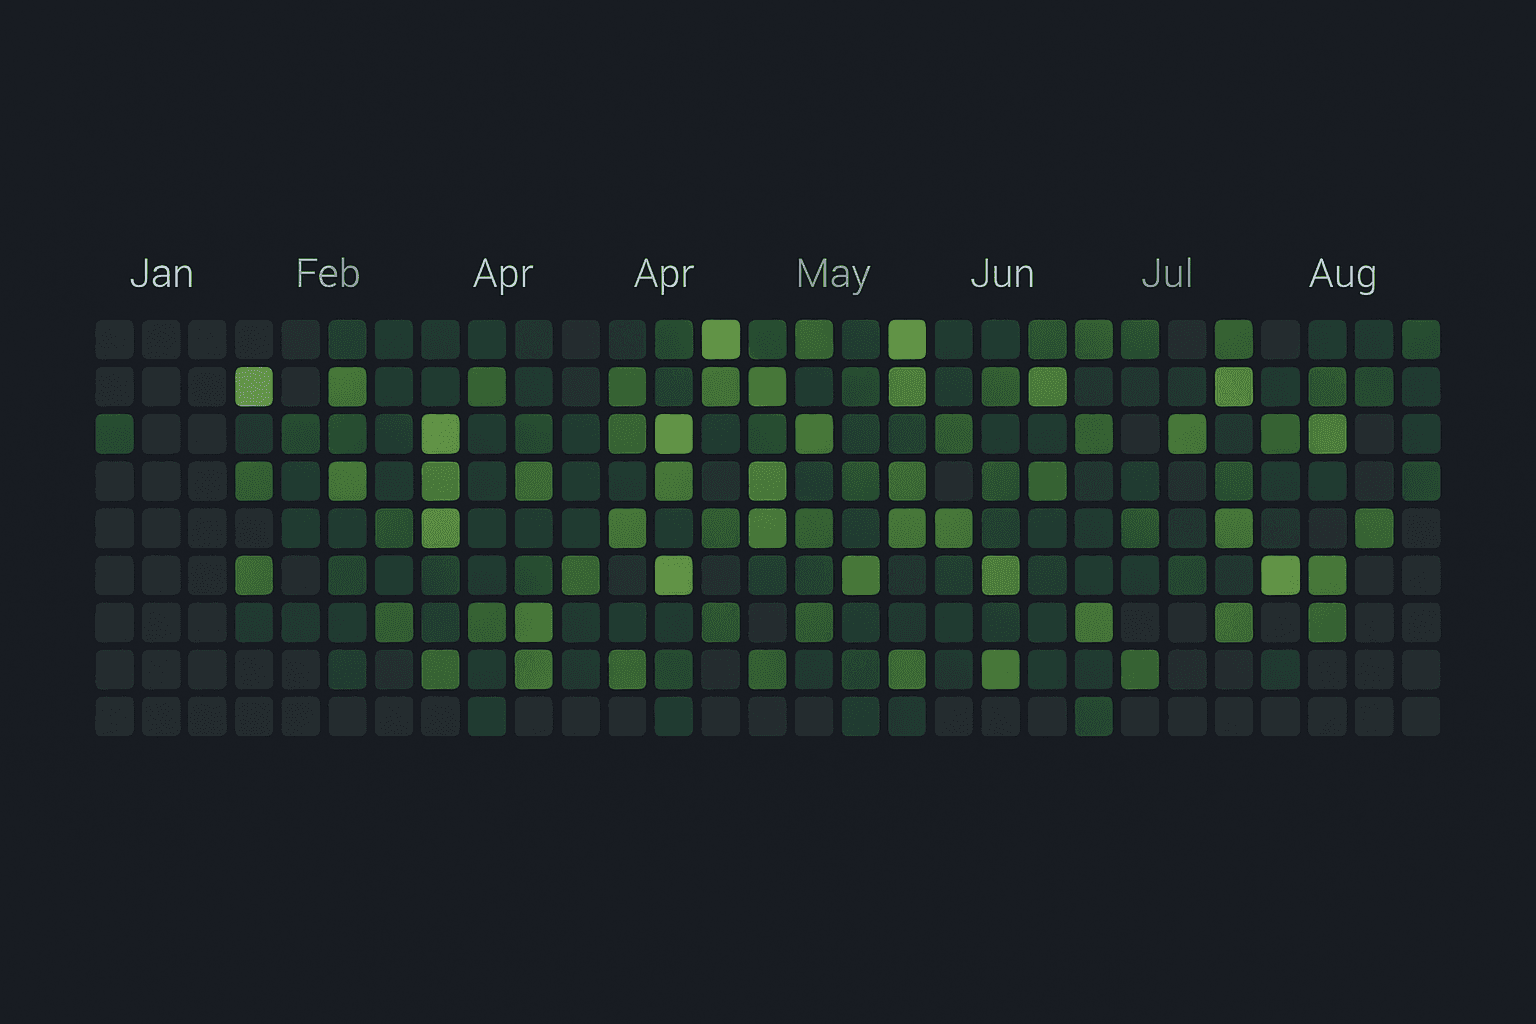
GitHub doesn't offer a direct embed for contribution graphs, so you'll need a custom solution. This guide shows how to fetch contribution data using GitHub's GraphQL API and display it in your Next.js app.

1: Fetching Contribution Data with GraphQL

Get contribution data via GitHub's GraphQL API. You'll need a personal access token with permission to read user contribution data. Store this securely, for example, as an environment variable (GITHUB_ACCESS_TOKEN_COMMIT_GRAPH).

The query to get the contribution calendar for a specific user and date range:

typescript
// lib/github.ts (example location)
import { graphql } from "@octokit/graphql"; // Assuming you use @octokit/graphql

interface GitHubGraphQLContributionResponse {
  user: {
    contributionsCollection: {
      contributionCalendar: {
        weeks: Array<{
          contributionDays: Array<{
            contributionCount: number;
            contributionLevel: string; // e.g., NONE, FIRST_QUARTILE
            date: string; // YYYY-MM-DD
          }>;
        }>;
        totalContributions: number;
      };
    };
  };
}

export interface ContributionDay {
  date: string;
  count: number;
  level: number; // 0-4
}

const GITHUB_USERNAME = "your-github-username"; // Replace with your username
const GITHUB_API_TOKEN = process.env.GITHUB_ACCESS_TOKEN_COMMIT_GRAPH;

export async function fetchGitHubContributions(
  fromDate: string,
  toDate: string,
): Promise<{ contributions: ContributionDay[]; totalContributions: number }> {
  if (!GITHUB_API_TOKEN) {
    throw new Error("Missing GITHUB_ACCESS_TOKEN_COMMIT_GRAPH environment variable.");
  }

  const { user } = await graphql<GitHubGraphQLContributionResponse>(
    `
      query ($username: String!, $from: DateTime!, $to: DateTime!) {
        user(login: $username) {
          contributionsCollection(from: $from, to: $to) {
            contributionCalendar {
              weeks {
                contributionDays {
                  contributionCount
                  contributionLevel
                  date
                }
              }
              totalContributions
            }
          }
        }
      }
    `,
    {
      username: GITHUB_USERNAME,
      from: `${fromDate}T00:00:00Z`,
      to: `${toDate}T23:59:59Z`,
      headers: {
        authorization: `bearer ${GITHUB_API_TOKEN}`,
      },
    },
  );

  if (!user?.contributionsCollection) {
    throw new Error("Incomplete data received from GitHub GraphQL.");
  }

  const contributionDays = user.contributionsCollection.contributionCalendar.weeks.flatMap(
    (week) => week.contributionDays,
  );

  const mapContributionLevel = (level: string): number => {
    switch (level) {
      case "NONE":
        return 0;
      case "FIRST_QUARTILE":
        return 1;
      case "SECOND_QUARTILE":
        return 2;
      case "THIRD_QUARTILE":
        return 3;
      case "FOURTH_QUARTILE":
        return 4;
      default:
        return 0;
    }
  };

  const contributions: ContributionDay[] = contributionDays.map((day) => ({
    date: day.date,
    count: day.contributionCount,
    level: mapContributionLevel(day.contributionLevel),
  }));

  return {
    contributions,
    totalContributions: user.contributionsCollection.contributionCalendar.totalContributions,
  };
}

This function fetches the data and transforms the contributionLevel strings (like FIRST_QUARTILE) into simple numbers (0-4) for easier rendering.

2: Caching the Data

To avoid hitting the GitHub API on every request, cache the results server-side. An in-memory cache like node-cache works well for this. Set a reasonable Time-To-Live (TTL), like 24 hours. This example refreshes data only after the TTL expires; it does not expose a public cache-invalidation parameter.

Example API route in Next.js:

typescript
// app/api/github-activity/route.ts (example location)
import { NextResponse } from "next/server";
import cache from "@/lib/cache"; // Your cache implementation
import { fetchGitHubContributions, type ContributionDay } from "@/lib/github"; // From Step 1

interface GitHubActivityApiResponse {
  source: "graphql" | "cache";
  data: ContributionDay[];
  totalContributions: number;
}

const GITHUB_ACTIVITY_CACHE_KEY = "github_activity_data";
const CACHE_TTL_DAILY = 24 * 60 * 60; // 24 hours in seconds

export async function GET() {
  const cachedData = cache.get<GitHubActivityApiResponse>(GITHUB_ACTIVITY_CACHE_KEY);
  if (cachedData) {
    // Add source indication for debugging/transparency
    return NextResponse.json({ ...cachedData, source: "cache" });
  }

  try {
    const today = new Date();
    const oneYearAgo = new Date(today);
    oneYearAgo.setFullYear(today.getFullYear() - 1);

    const fromDate = oneYearAgo.toISOString().split("T")[0]; // YYYY-MM-DD
    const toDate = today.toISOString().split("T")[0]; // YYYY-MM-DD

    const { contributions, totalContributions } = await fetchGitHubContributions(fromDate, toDate);

    const activityData: GitHubActivityApiResponse = {
      source: "graphql",
      data: contributions,
      totalContributions: totalContributions,
    };

    cache.set(GITHUB_ACTIVITY_CACHE_KEY, activityData, CACHE_TTL_DAILY);
    return NextResponse.json(activityData);
  } catch (error) {
    // Octokit errors can contain request headers; log only the selected message.
    console.error(
      "Error fetching GitHub contributions:",
      error instanceof Error ? error.message : "Unknown GitHub API error",
    );
    // Return an error response or potentially stale cache data if available
    return NextResponse.json(
      { error: "Failed to fetch GitHub activity" },
      { status: 500 },
    );
  }
}

This API route first checks the cache. If data is missing or has expired, it fetches fresh data from GitHub using the function created in Step 1, caches it, and then returns it.

3: Rendering the Graph

With the data fetched (likely via a client-side fetch to your API route or passed as props from a server component), you can render the graph. A simple grid using CSS Grid and Tailwind CSS works well.

tsx
// components/ContributionGraph.tsx (example component)
import React from "react";
import type { ContributionDay } from "@/lib/github";

const getLevelColor = (level: number): string => {
  // Tailwind classes for different contribution levels
  // Adjust colors to match your site's theme
  switch (level) {
    case 0:
      return "bg-gray-100 dark:bg-gray-800"; // No contributions
    case 1:
      return "bg-green-200 dark:bg-green-900"; // Low
    case 2:
      return "bg-green-400 dark:bg-green-700"; // Medium
    case 3:
      return "bg-green-600 dark:bg-green-500"; // High
    case 4:
      return "bg-green-800 dark:bg-green-300"; // Very high
    default:
      return "bg-gray-100 dark:bg-gray-800";
  }
};

interface ContributionGraphProps {
  data: ContributionDay[];
  totalContributions: number;
  isLoading?: boolean;
}

export function ContributionGraph({ data, totalContributions, isLoading }: ContributionGraphProps) {
  if (isLoading) {
    // Optional: Add a loading skeleton state
    return <div className="p-2">Loading contributions...</div>;
  }

  if (!data || data.length === 0) {
    return <div className="p-2">Could not load contribution data.</div>;
  }

  return (
    <div>
      <p className="text-sm text-gray-600 dark:text-gray-400 mb-2">
        {totalContributions.toLocaleString()} contributions in the last year
      </p>
      <div className="grid grid-flow-col grid-rows-7 gap-1 p-2 border rounded-md dark:border-gray-700 overflow-x-auto bg-white dark:bg-gray-900/50">
        {data.map((day) => (
          <div
            key={day.date}
            className={`w-3 h-3 rounded-sm ${getLevelColor(day.level)}`}
            title={`${day.count} contribution${day.count !== 1 ? "s" : ""} on ${day.date}`} // Tooltip
          />
        ))}
      </div>
    </div>
  );
}

This component maps each ContributionDay to a colored square, using the level (0-4) to determine the background color via the getLevelColor helper.

Bonus: Fixing Hydration Errors

Sometimes when making components interactive, like wrapping them in links, you might encounter React hydration errors due to invalid HTML nesting (e.g., an <a> inside another <a>).

Problematic (can cause errors):

jsx
<a href="URL">
  <div> {isLoading ? <a href="URL">Loading...</a> : content} </div>
</a>

Solution (keep the outer link and use a noninteractive loading element):

jsx
<a href="URL">
  {isLoading ? <span>Loading...</span> : content}
</a>

The real anchor preserves native keyboard navigation, link semantics, and open-in-new-tab behavior without scripted navigation. Keep content free of nested links or other interactive controls too.